- Data
- Videos
-
Publications & Research
Southwest Regional Climate Hub and California Subsidiary Hub Assessment of Climate Change Vulnerability and Adaptation and Mitigation Strategies -
Education
- Water Conservation Data Jam - Curriculum for 6th-12th Grade Students
- Climate Change and Wildfire – Curriculum Unit for 9-12 Grade Students
- Climate Change and the Carbon Cycle – Curriculum Unit for 9-12 Grade Students
- Where's Our Water? Water Conservation in the Southwest - Lesson for 6-8 Grade Students
- Climate Change and the Water Cycle - 10-Hour Curriculum Unit for 6-12 Grade Students
- The Effects of Climate Change on Agricultural Systems - 5-Hour Curriculum Unit for 6-12 Grade Students
- Cambio climatico y el ciclo del agua
- Webinars and Online Courses
- Websites
- News & Events
- About Us
- RMA

Interactive Maps - Temperature and Precipitation by County
| Interactive Maps - | ||
Maximum Temperature 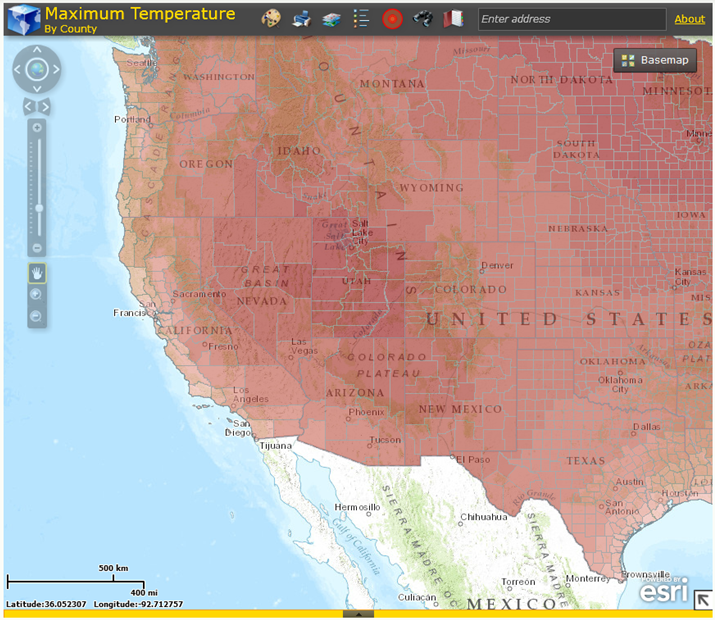 |
Minimum Temperature 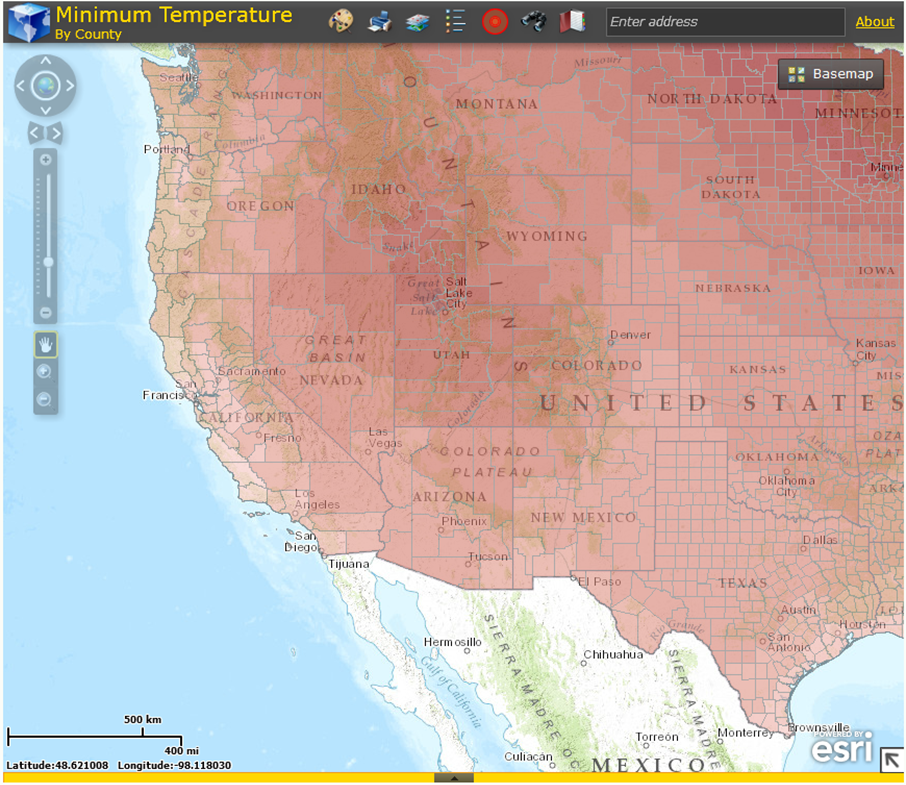 |
Precipitation 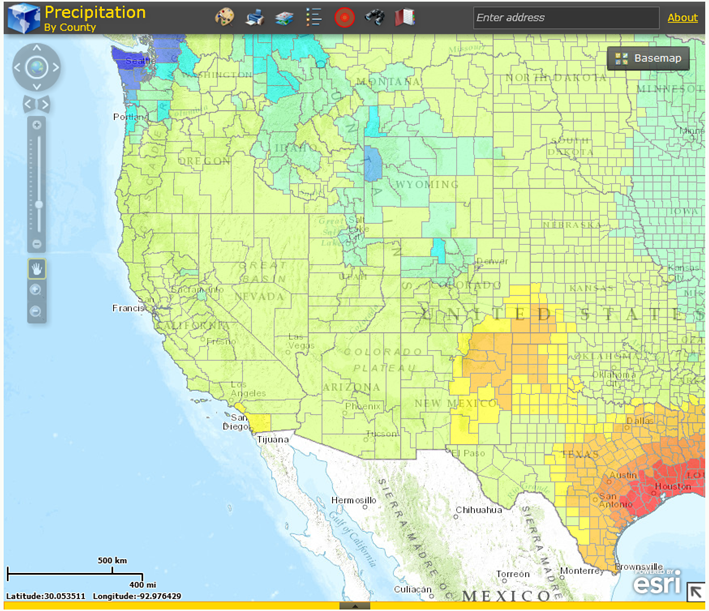 |
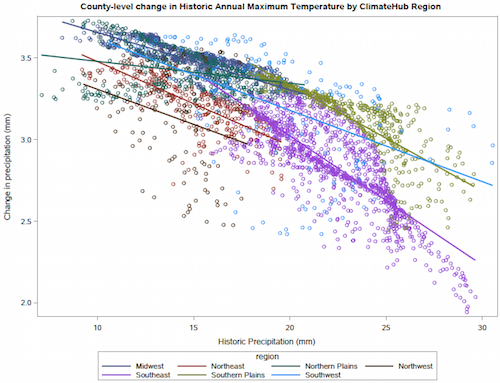
We used the Multivariate Adaptive Constructed Analogs (MACA) statistically downscaled data to generate a period change analysis (1971-2000) vs. (2040-2069) of minimum temperature, maximum temperature, and change in precipitation upscaled to the county level. These data are provided for both seasonal and annual time periods. Data are intended to provide a general estimate of broad seasonal changes in temperature and precipitation at the county scale to aid planning and management amid uncertainty. Maps of standard deviation between models and within counties are intended to provide a range of certainty associated with the projections.
Data
Base data used - We use the 30 year normal data from the PRISM Climate Group for the 1971 to 2000 time period to represent the historic base temperature and precipitation. A description of the PRISM model, an uncertainty analysis and methods for creating the 1971-2000 normal data are described by Daly et al. (2008). This is a monthly 30-year normal dataset covering the conterminous US, averaged from 1971-2000. See http://www.prism.oregonstate.edu/ for more information about the base data set.
Resolution: 800 m
Time period: 1971 – 2000
Future data used - We use the Multivariate Adaptive Constructed Analogs (MACA) (Abatzoglou and Brown 2012) downscaled temperature and precipitations projections from 20 general circulation models of the Coupled Model Inter-comparison Project 5 (CMIP5) for the future time period (2040-2069) and the Representative Concentration Pathway 8.5 (RCP 8.5).
Resolution: 4 km
Time period: 2040-2069
Model: mean of 20 CMIP5 models for minimum temperature, maximum temperature, and precipitation
Scenario: RCP 8.5
Methodology
We downloaded monthly PRISM data and calculated the mean minimum temperature, maximum temperature, and precipitation on a seasonal and annual basis. ArcGIS was used to generate average values for minimum and maximum temperature and precipitation at the county level.
The change (1971 – 2000) vs. (2040 – 2069) in minimum and maximum temperature and precipitation for annual and seasonal timesteps for RCP8.5 was downloaded from MACA. Average change in temperature and precipitation values for the year and four seasons are summarized at the county level.
PRISM normals data and the change in temperature or precipitation from MACA data are combined to generate predicted future annual and seasonal temperature and precipitation averages at the county level for the nation.
Variables
Minimum temperature, maximum temperature, and precipitation
Scale of data: county
Please direct data questions to: Emile Elias (emile.elias@usda.gov)
Request Data
Want to use this data? Request here